
Networking monitoring with a RaspberryPI
A while back my house mates and I found that our internet connection was terribly slow in the evenings.
I decided to use my newly arrived Raspberry Pi to write some monitoring tools to see what the pattern was and how bad it was. This way we would also have something to give to Virgin Media to show there was a problem. At the same time, I had been wanting to write some software to push data into the graphing system Graphite, so this seemed like a good time to do that.
A note on the problem
A quick ping showed::
64 bytes from cpc2...virginmedia.com (...) time=2304 ms
which is terrible. Ping times were consistently worse than even that in the evenings, for several hours at a time. I started by just checking the ping times to the gateway using
export GATEWAY=`traceroute virginmedia.com | head -5 | grep
cable.virginmedia.com | cut -f 4 -d ' '`
traceroute virginmedia.co.uk > virginmedia_traceroute.txt
ping -c 100 $GATEWAY > gateway_ping.txt
It became quickly obvious that it would be much more interesting to see how this changed over the course of the day. I really didn’t want to try and wait for the problems to occur before getting data about it. What I wanted was to see the problem clearly, highlighted like this:
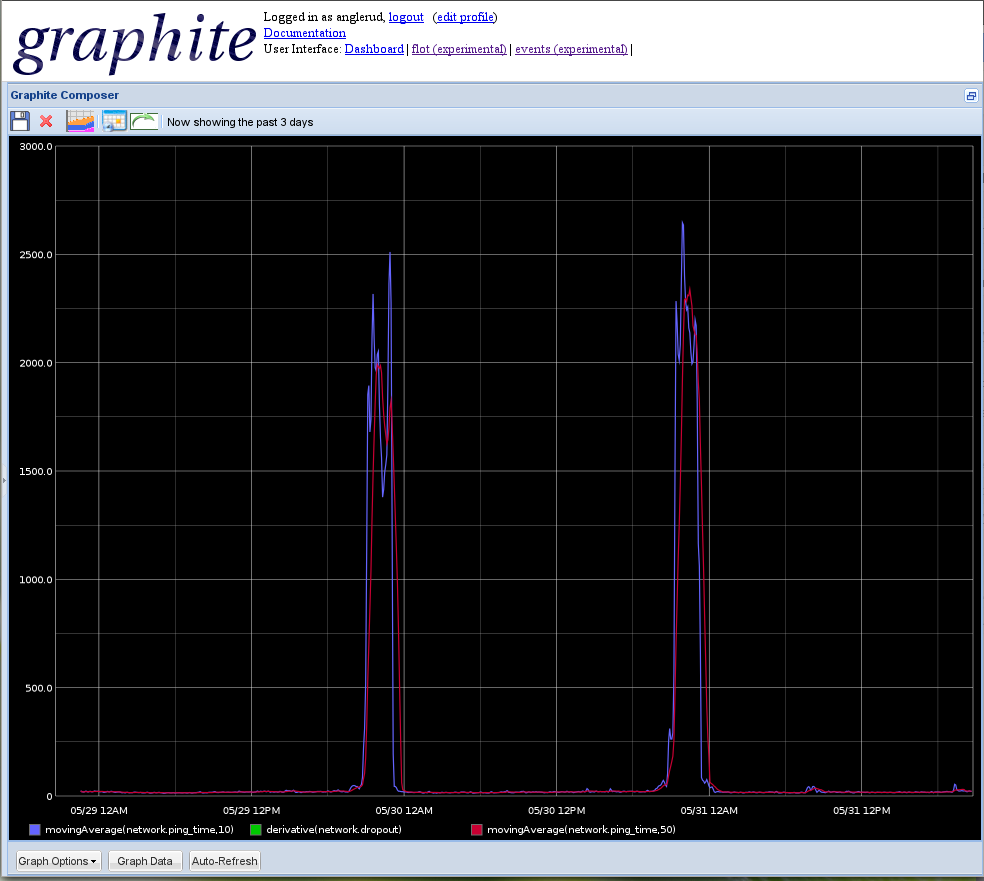
As you can see from the above image, ping times shot up to four seconds in the evening, so it’s not surprising that everything felt wrong.
My approach
The software I picked to write this consisted of
- Python: my favourite programming language.
- Graphite: the fast graphing toolkit.
- Sh: an easy way to interact with the Unix command set from Python.
- Ping: the standard way to see response times from hosts on the internet, this version is written in Python.
- Argh: a wonderfully simple way to read command line arguments, much simpler than the built-in Argparse.
I could of course have used the Sh module to do all of this, or even just plain bash. However, it was enjoyable writing this little tool, and I didn’t want to spend too much time grepping text files. I wanted this to run for a fortnight or so to get the best possible data.
How it’s all wired together
First up, I call out to the system’s traceroute command, using the ‘sh’
module. I then look through the output to find the cable gateway, which I
know contains the strings virginmedia.co.uk and cable. Since it’s a quick
hack, I’ve hardcoded it - but it wouldn’t be much more work to get it as a
default argument on the command-line. This is how I did it:
def find_gateway():
  gateway_lines = [l for l in sh.traceroute('virginmedia.co.uk').split('\n')
                   if '.cable.' in l]
  return gateway_lines[0].strip().split()[1]
A quick google showed there was a really convenient ‘python-ping’ module one could grab. The module is originally written by Matthew Dixon Cowles and was rewritten by Johannes Meyer. Using it to ping a host is as simple as:
def ping_host(host_name):
    delay = ping.do_one(host_name, 9)

    if not delay:
        return None

    return round(delay * 1000, 4)
Once I have the ping data the job is nearly done. The next task was to get this data into Graphite. There are a lot of nice Python libraries to push data to Graphite - but as I was sending such a simple set of metrics to it, at such a slow pace, I just connected straight to it. Sending a value is absolutely trivial:
def send_metric(name, value):
  sock = socket.socket()
  sock.connect( ("localhost", 2003) )
  sock.send("%s %d %d\n" % (name, value, now()))
  sock.close()
Gluing these things together is very simple. Find out what to ping, ping it repeatedly and tell Graphite how long each one took:
def main():
    failures = 0
    gateway_host = find_gateway()
    print 'Measuring ping latency to {}'.format(gateway_host)

    try:
        while True:
            ping_time = ping_host(gateway_host)

            if not ping_time:
                failures += 1
                send_metric("network.dropout", failures)
                print 'packet lost'
            else:
                send_metric("network.ping_time", ping_time)
                print 'ping_time: {}'.format(ping_time)

            time.sleep(10)
    except KeyboardInterrupt:
        pass
Then, to create a command-line interface, you can use the wonderful ‘Argh’ module. Argh makes it this simple:
if __name__ == '__main__':
    argh.dispatch_command(main)
I just can’t recommend the Argh module enough, it’s become a mainstay of my tool set. It makes creating command line interfaces as easy as creating a main method that receives the parameters you desire. Read about it at readthedocs. Even if the script I’m writing doesn’t take any arguments, I still use it as it produces nice help output. Once done, just run this software like this:
$ ./gateway_pinger.pyThe Raspberry Pi
I wanted to run this for at least a week without having to keep my noisy computer on, and I also wanted to be able to access this through the browser. The Raspberry Pi would make both easy. Once I installed Graphite on to the Raspberry Pi, I could run this script on there.
Installing Graphite is as simple as apt-get install graphite-carbon. There is
one small thing you’ll need to do, and that is to update the
/etc/carbon/storage-schemas.conf file to store more data than the default.
I’ve set mine to downsample data to 1m increments after a while.
[network]
pattern = ^network\.
retentions = 10s:6h,1m:7d,10m:1y
What did it accomplish?
I got to write some fun software, which I really enjoyed - and I got to use Graphite and found it to be both easier and more capable than I had first thought. I was also happy to have found a useful task for the Raspberry Pi.
The whole project took about an evening’s work, followed by some time tweaking it to be prettier.
The resulting graphs were shown to anyone willing to stay still for long enough, and the data was passed on to Virgin Media. The network graph is now beautifully smooth, indicating a lack of packet loss and latency spikes.